Measuring the D0 lifetime at LHCb
1- Introduction
The Large Hadron Collider (LHC) is not only a tool with which to search for exotic new particles, but also a factory of particles whose existence is in no doubt but whose precise properties are not yet known well enough. One example are charmed particles, i.e. particles which contain a charm (also known as c) quark, which were first discovered more than 30 years ago. Approximately one in every ten LHC interactions produces a charmed particle, and the LHCb experiment at the LHC has already recorded over one billion events containing charmed particles.
Even though the LHC produces a lot of charmed particles, it produces a much greater number of other particles which can be mistaken for the signal (“backgrounds”). In order to extract information from such large signal samples, it is necessary to achieve excellent control over these backgrounds. Today you will be performing exercises using real collisions recorded by the LHCb experiment during 2011 datataking, which contain both signal and background particles. This set of exercises is designed to teach you how to
- 1. Use an event display of the proton-proton collisions inside the LHCb detector to search for charmed particles and separate this signal from backgrounds.
- 2. Fit functional forms for the signal and background to the data in order to measure the number of signal events in the data sample and their purity (defined as the fraction of signal events in the total sample).
- 3. Obtain the distribution of signal events in a given variable by taking the combined distribution of events in the data sample (which contains both signal and background events) and subtracting the background distribution. The result of the fit in the previous step is used to find a sample of pure background events for subtraction, and to compute from the signal yield and purity the appropriate amount of background which should be subtracted.
- 4. The signal you will be looking at decays exponentially with time, analogously to a radioactive isotope. You can now use the sample of events passing the previous step to measure the “lifetime” of the signal particle. The lifetime is defined as the time taken for (e-1)/e of the signal events to decay, where e~2.718 is the base of the natural logarithm. It is analogous to the concept of half-life in radioactive decay.
The data sample used for this exercise consists of candidates for a type of charmed particle known as a D0 particle found in a sample of randomly collected LHC interactions during 2011 datataking. A D0 particle consists of a charm quark and an up anti-quark. The particles are measured decaying in the mode D0→K–π+ where the final state particles are a kaon (K–) consisting of a strange quark and an anti-up quark, and a pion (π+) which consists of a down anti-quark and an up quark. The +, – and 0 refer to the electric charge of the particle, whether it is positively charged, negatively charged or neutral. These particles have lifetime which are long enough that, for the purpose of this exercise, they are stable within the LHCb detector. The particles have been preselected using loose criteria so that you begin the exercise with a visible signal, but background events are also present.

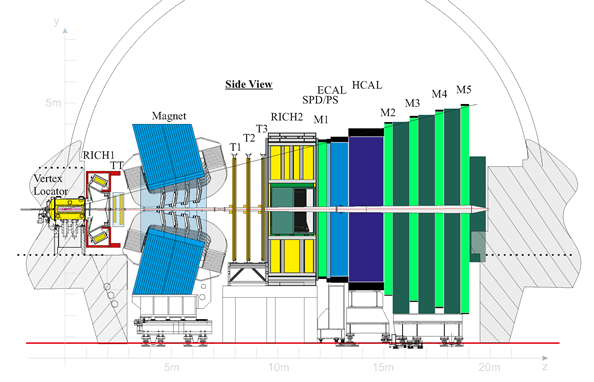
Figure 1: The LHCb detector. The Z axis is the direction of the LHC beamline.
Click the image for higher resolution.
Before discussing the exercise further, it is worth taking the time to familiarize yourselves with the LHCb detector, shown in Fig. 1. It is a forward spectrometer covering the angular range between 0.7° and 15° relative to the LHC beamline. The beamline is located at y = 0 in the picture and runs in the z direction. In what follows “transverse” means transverse to the LHC beamline, “upstream” is towards smaller values of z and “downstream” is towards greater values of z. The detector includes a high-precision system for tracking charged particles consisting of a silicon-strip detector surrounding the proton-proton interaction region, a large-area silicon-strip detector located upstream of a dipole magnet with a bending power of about 4Tm, and three stations of silicon-strip detectors and straw drift tubes placed downstream. Charged particles leave straight line tracks in the detector surrounding the interaction region, where there is no magnetic field, and are subsequently bent by the magnet before leaving tracks in the downstream tracking station. Their momentum and charge can be deduced from the curvature induced by this magnetic field. The combined tracking system has a momentum resolution Δp/p that varies from 0.4% at 5 GeV/c to 0.6% at 100 GeV/c, an impact parameter1 resolution of 20 μm for tracks with high transverse momentum, and a lifetime resolution of 50 fs.

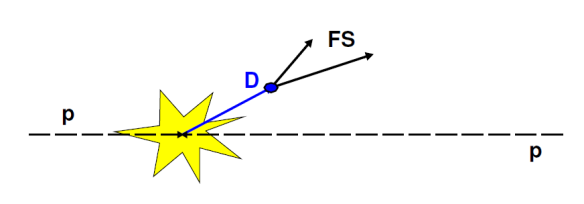
Figure 2: The D0 particle secondary vertex (“D”) displaced from the pp interaction (yellow star-like blob).
A distinctive feature of D0 particles is their measurably long lifetime (the object of this exercise). From a practical point of view, this means that they form a “secondary” vertex which is displaced from the “primary” proton-proton interaction. This is illustrated in Fig. 2. This fact, together with their abundant production rate mentioned earlier, allows the D0 signals to be well separated from the background of the underlying event, most of which consists of random combinations of particles produced in the proton-proton collision.
The data is provided together with a graphical user interface (GUI) which you can use to access it – go ahead and execute it. You can access online instructions from the GUI using the “help” button. The exercise consists of two parts: the first is an event display which you can use to search for the displaced vertices of D0 particles inside the LHCb detector, the second is a fiter which you can use to separate signal from background and measure the lifetime of the D0 particles.
2- Event display exercise
The aim of the event display exercise is to locate displaced vertices belonging to D0 particles in the vertex detector of the LHCb experiment. When you launch the exercise and load an event, you will see an image of the LHCb detector and particle trajectories (“tracks”) inside it. These tracks are colour coded, and a legend at the bottom of the GUI tells you which colour corresponds to which kind of particle.


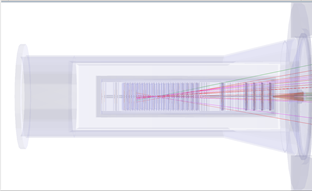
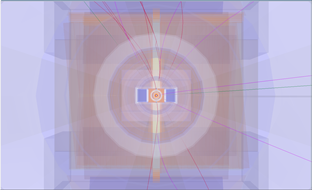
Figure 3: Three views of one event, from top to bottom : y-z, y-x, and x-z.
click the images for higher resolution
In order to make identifying vertices easier, you can view an event in three different two-dimensional projections : y-z, y-x, and x-z, show for one event in Fig. 3. Different events will be clearer in different projections, so feel free to experiment with all three! Displaced vertices appear as a pair of intersecting tracks, far away from the other tracks in the event. When you click on a particle, you will see its information, including mass and momentum, in the Particle Info box.
A D0 particle decays into a kaon and a pion, so you will need to find a displaced vertex where a kaon track intersects with a pion track. Once you find a track which you think is part of the displaced vertex, you can save it using the Save Particle button. Once you have saved two particles, you can compute their mass by clicking on the Calculate button. If you think this combination has a mass compatible with that of the D0 particle, click on Add to save it : by saving a combination for each event, you will build up a histogram of the masses of the displaced vertices in the different events.
Remember that you are looking at real data so it contains both signal and background, and the detector has a finite resolution, so not all displaced vertices will have exactly the D0 mass (even the signal ones). They should, however, be within the range 1816-1914 MeV (this range is around 3% each way around the true D0 mass). If you try to save a combination which is too far away from the real D0 mass the exercise will warn you that you have not found the correct displaced vertex pair and won’t let you save it.
If you are not able to find the displaced vertex for an event after a few minutes, move on to the next event and come back to the one which was giving you trouble if you have time at the end of the exercise. Once you have looked at all events, you can examine your mass histogram by clicking the Draw button. Discuss the shape with a moderator.
At the end, please remember to click on Save Histogram in order to save your histogram to disk! It will then be combined by the moderators with the histograms of the other students and you should discuss your results as a group
3- Fitting exercise
Before describing the fitting part of the exercise, it will be useful to list the variables involved in this exercise :
- D0 mass: this is the invariant mass of the D0 particle. The signal can be seen as a peaking structure rising above a at background. The range of masses relevant for this analysis is 1816-1914 MeV. The signal shape is described by the Gaussian (also known as “normal”) distribution. The center (“mean”) of this distribution is the mass of the D0 particle, while the width represents the experimental resolution of the detector.
- D0 TAU: this is the distribution of decay times of the D0 candidates. The signal is described by a single exponential whose slope is the D0 lifetime (the object of the last exercise), while the background concentrates at short decay times.
- D0 IP: this is the D0 distance of closest approach (“impact parameter”) with respect to the proton-proton interaction in the event. The smaller the impact parameter, the more likely it is that the D0 actually came from that primary interaction. In order to simplify the drawing, we actually plot and cut on the logarithm (base 10) of this quantity in the exercise.
- D0 PT: this is the momentum of the D0 transverse to the LHC beamline. Now let’s proceed through the exercise itself.
3.1- Exercise 1 : fitting the mass distribution and obtaining signal variable distributions
The object of this exercise is to fit the distribution of the D0 mass variable, and extract the signal yield and purity.
- 1. Click on the Plot D0 mass button to plot the overall mass distribution. You will see a peak (signal) on top of a at distribution (background). The peak should be described by a Gaussian function, whose mean corresponds to the mass of the D0 and whose width (σ) is determined by the experimental resolution of the LHCb detector.
- 2. Click on Fit mass distribution to fit this distribution using a Gaussian function for the signal and a linear function for the background.
- 3. Look at the fitted mass distribution. You can split it into three regions: the signal region and two background-only “sidebands”: one above the signal (the upper sideband) and one below the signal (the lower sideband). A Gaussian distribution contains 99.7% of its events within three standard deviations of the mean, so this “three σ” region around the mean is usually the definition of the signal region.
- 4. Use the slider labelled Sig range to define the beginning and end of the signal region. All events not falling into the signal region will be said to fall into the background region.
- 5. You can now use the definitions of the signal and background regions in the mass variable to determine the signal and background distributions in other variables. Click on the button labelled Apply cuts and plot variables. You will see the signal (blue) and background (red) distributions for the other three variables plotted next to the mass distribution. You should discuss the exercise with an instructor at this point.
3.2- Exercise 2 : measuring the D0 lifetime
The object of this exercise is to use the signal sample which you obtained in the previous step to measure the lifetime of the D0 particle. This is the same quantity as the half-life of a radioactive particle: the D0 decays according to an exponential distribution, and if this exponential is fitted to a distribution of the D0 decay times, the slope of this exponential is the lifetime of the D0.
- 1. Fit the lifetime of the D0.
- 2. Compare the slope of this exponential to the D0 lifetime given by the Particle Data Group. Talk to an instructor about how well these agree with each other.
- 3. In addition to statistical uncertainties, measurements can suffer from systematic uncertainties, caused by a miscalibrated apparatus or an incorrect modelling of the backgrounds. One basic technique for estimating these is to repeat the measurement while changing the criteria used to select signal events. If the result changes significantly when changing the criteria, we know that there is something wrong!
- 4. Repeat your fit for the lifetime of the D0 while varying the maximum allowed D0 impact parameter. The allowed values range from -4.0 to 1.5 in the original fit. Move this upper value from 1.5 to -2.0 in steps of 0.25, and refit the D0 lifetime at each point, saving the results as you go along.
- 5. Plot the histogram showing the fitted value of the D0 lifetime as a function of the upper cut on the impact parameter. Discuss the shape, and what it tells you about the D0 lifetime, with an instructor.
- 6. What other sources of systematic uncertainty might we need to consider when making a lifetime measurement?
Link to the webpage of the exercise
Introductory slides in English
pdf, ppt, key
Video Conference talk
pdf
Video Conference Quiz
pptx
Video of the exercise demo
mp4, avc
Introductory slides in French
HTML slides
Printable instructions
(pdf files in different languages)
English
French
German
Italian
Portuguese
Romanian
