

m1-m2 = 6.4×10⁻⁶ eV = 0.00000000000000000000000000000000000001 grams (1×10-38g)
(m1-m2)/(D0mass) = 3×10-15
Today, the LHCb Collaboration submitted a paper for publication that reports the first observation of the mass difference between neutral charm mesons (or rather their mass eigenstates for experts). The result is also presented today at the CERN seminar and was reported last week at the 10th International Workshop on CHARM Physics. This mass difference determines the frequency of D0–D0 neutral charm meson oscillations in which the D0 particle composed of a charm quark bound with an up antiquark turns into its own antiparticle composed of a charm antiquark and an up quark. The oscillation phenomenon is a fascinating feature of quantum mechanics. The value announced today represents one of the world’s smallest mass difference between two particles of 6.4×10⁻⁶ eV or, when converted to more conventional units, 0.00000000000000000000000000000000000001 grams (1×10-38g).
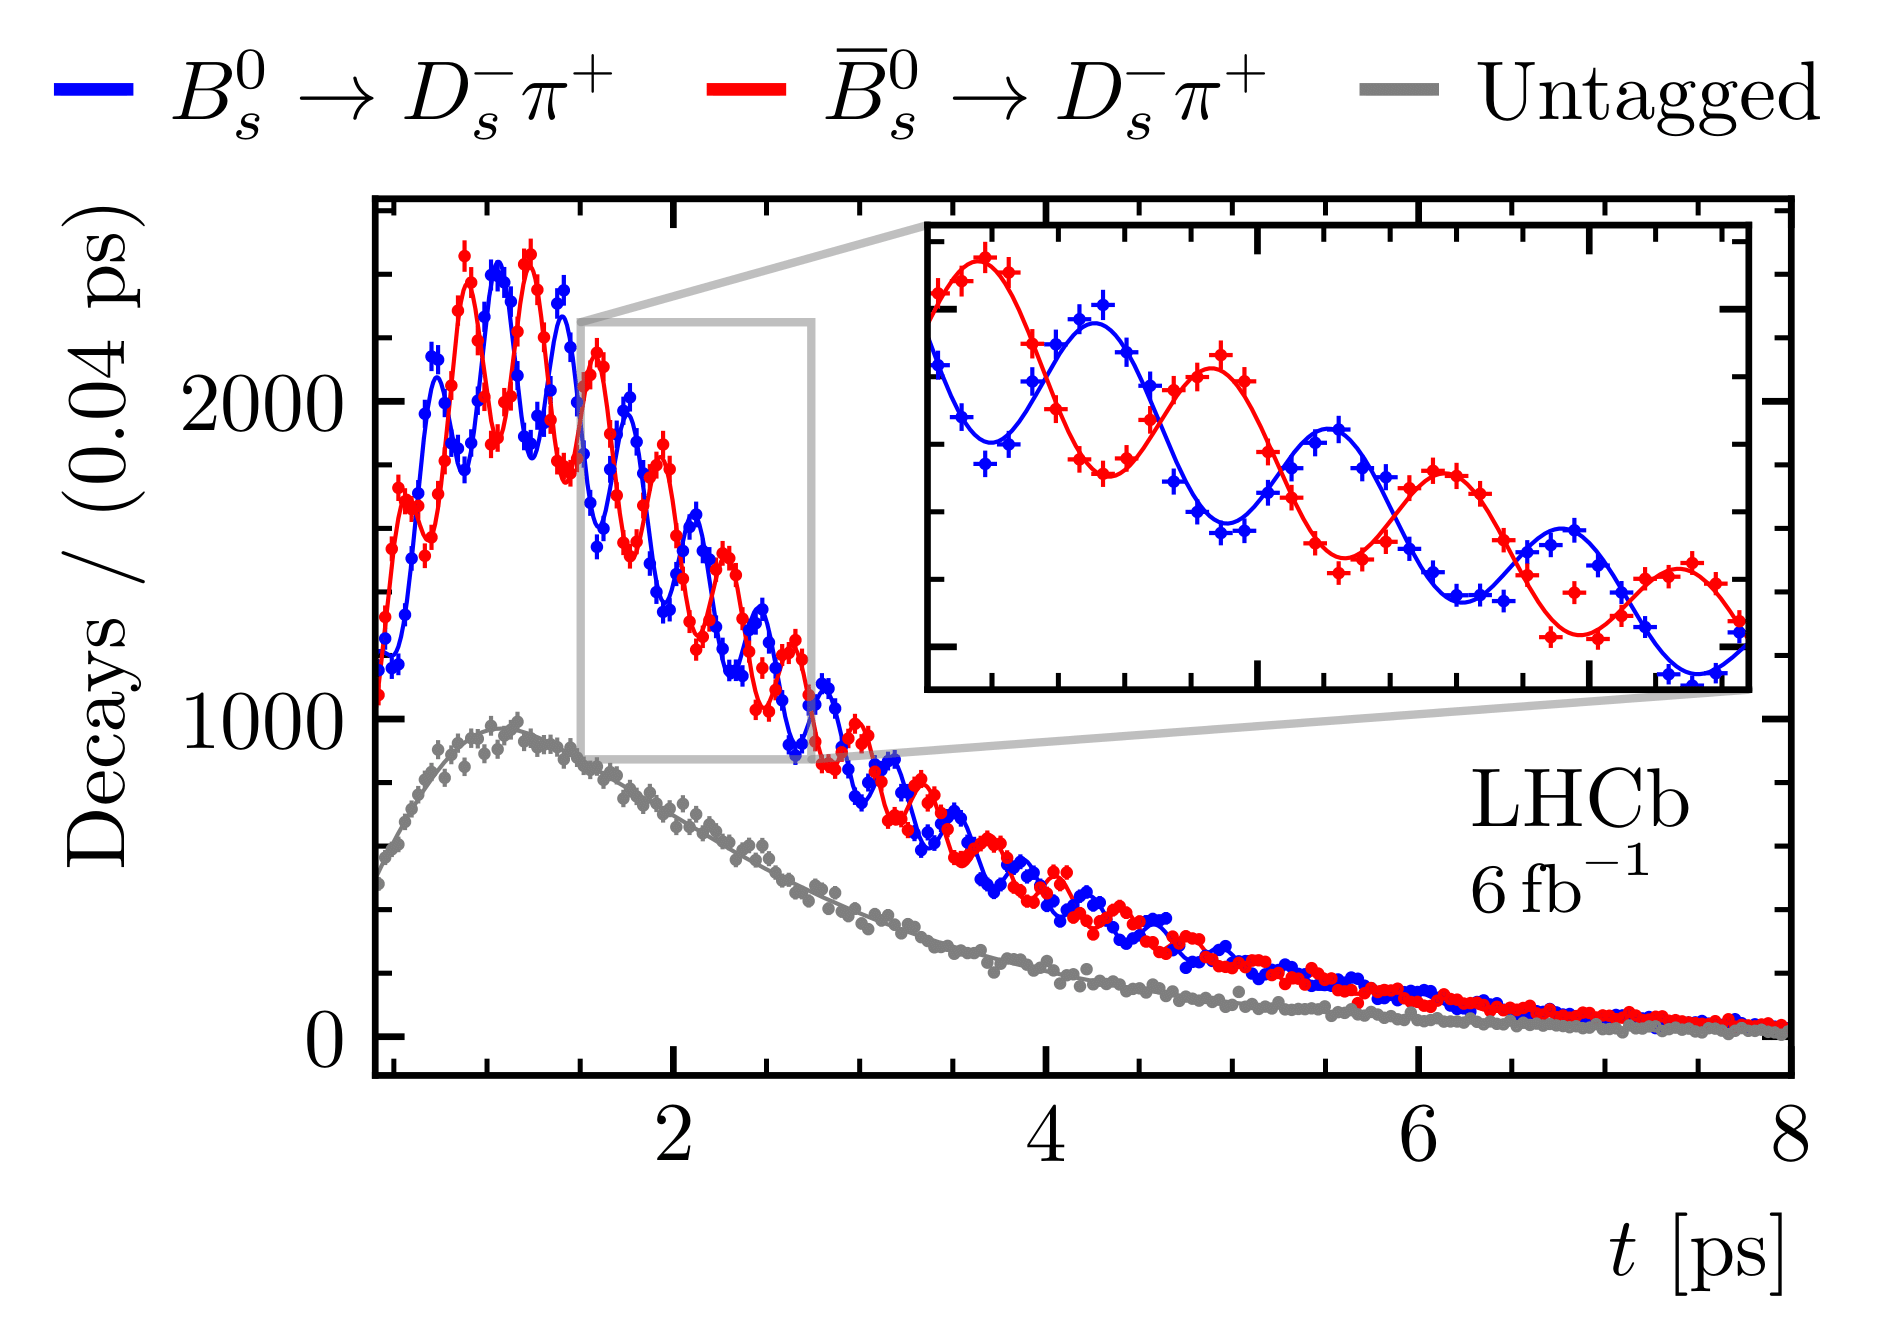
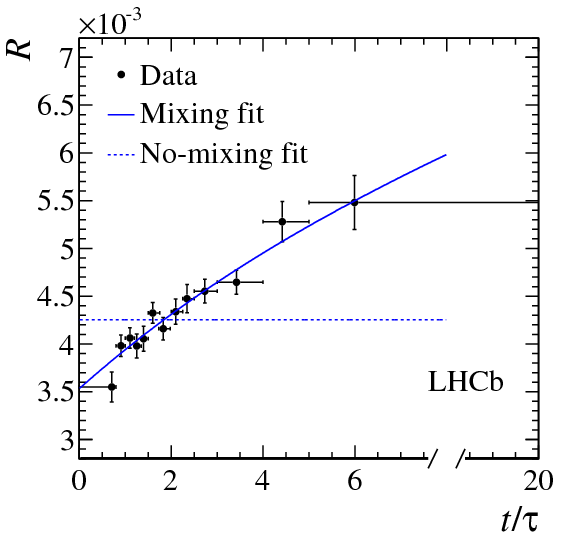
The neutral meson particle-antiparticle systems, Bs0−Bs0, B0–B0 and D0–D0 oscillate with very different frequencies. The Bs0−Bs0 oscillations are the fastest, about 3 million million times per second (3*1012). The oscillations B0–B0 are about 37 times slower while the oscillations D0–D0 are even slower; the oscillation period is over one hundred times larger than the average lifetime of a D0 meson. Therefore only the first part of the oscillation period is observed experimentally. The image to the left shows the Bs0−Bs0 very well visible oscillation pattern, the right image shows the beginning of the D0–D0 oscillation period. Both measuremements were performed by LHCb.
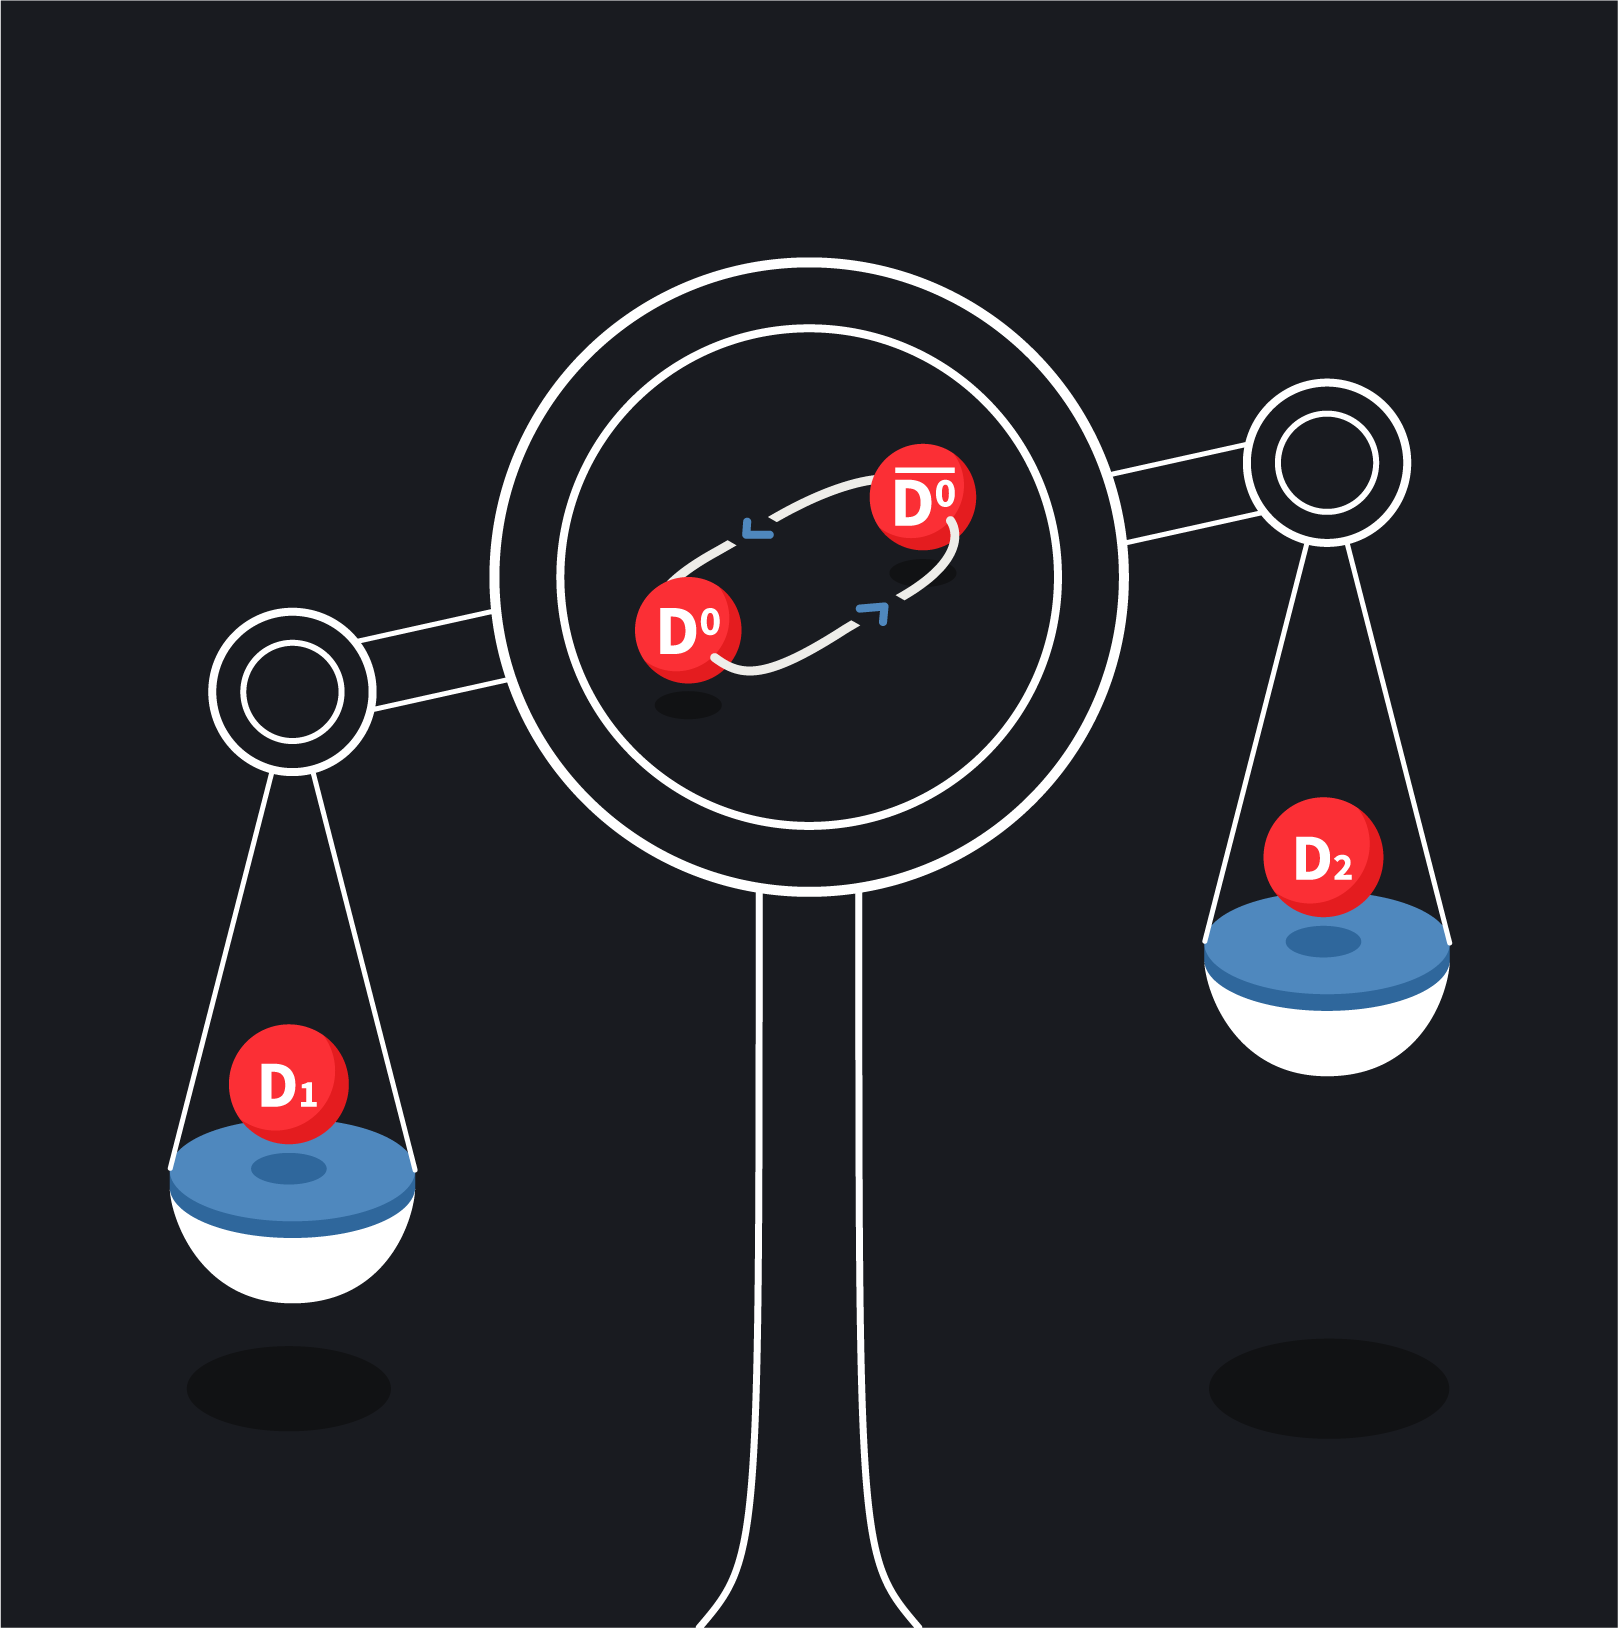
The quantum mechanical treatment of neutral charm meson oscillations leads to two neutral mesons, D1 and D2, each with their own mass, m1 and m2, and typical lifetime represented by their decay width, Γ1 and Γ2. The mass difference, m1-m2, determines the frequency of oscillations as shown in this cartoon view of the phenomenon. For neutral charm mesons this mass difference is included traditionally in the dimensionless parameter x= (m1-m2)/Γ in which Γ is the average width, (Γ1+Γ2)/2. Until today the measured value of x was marginally compatible with zero.
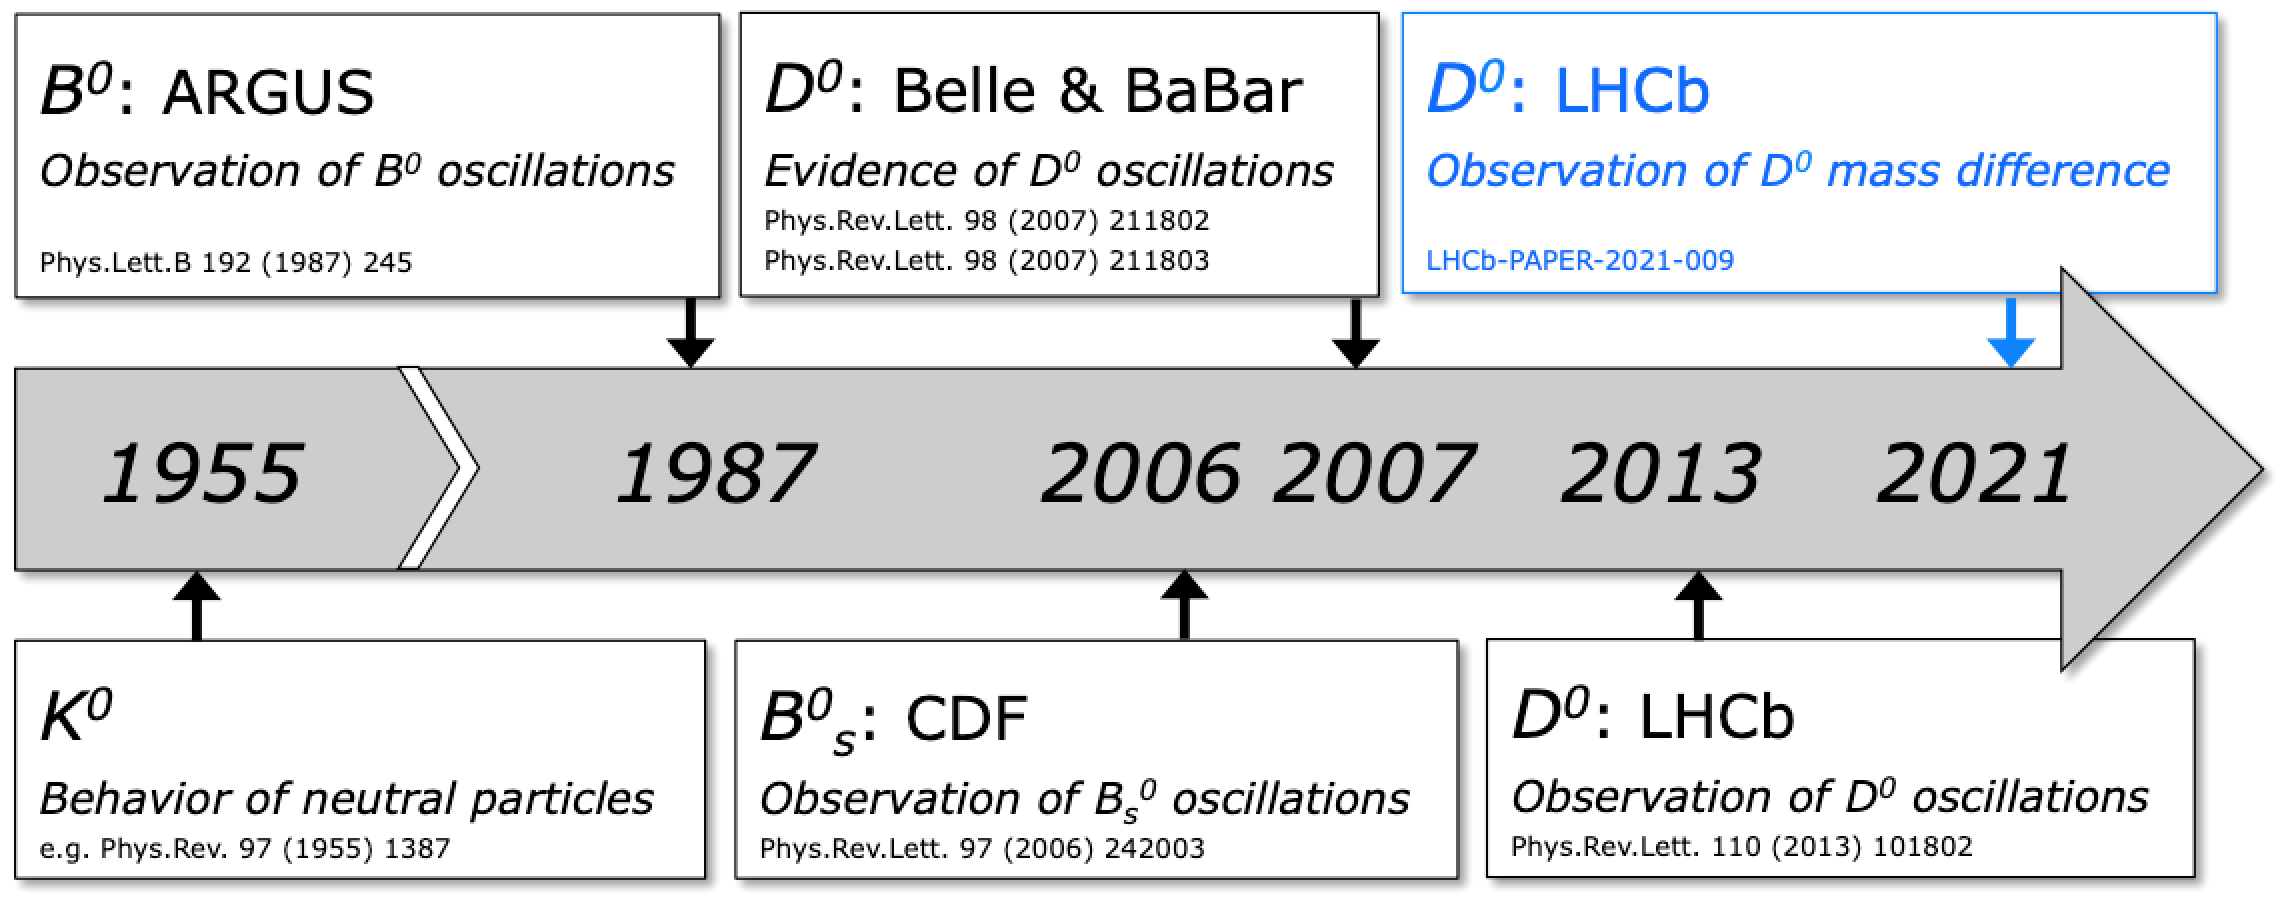
The LHCb collaboration has announced two month ago the precise determination of the heavy and light strange beauty meson mass difference determining in this way the Bs0−Bs0 oscillation frequency. The LHCb collaboration announced the first observation of the D0–D0 oscillations in November 2012 by excluding no-oscillation (no-mixing) flat distribution by more than 5 standard deviations in the “discovery” plot shown as the right oscillation image above. Today’s measurement of the mass difference determining the frequency of these oscillations is another important milestone in the neutral meson oscillation history.
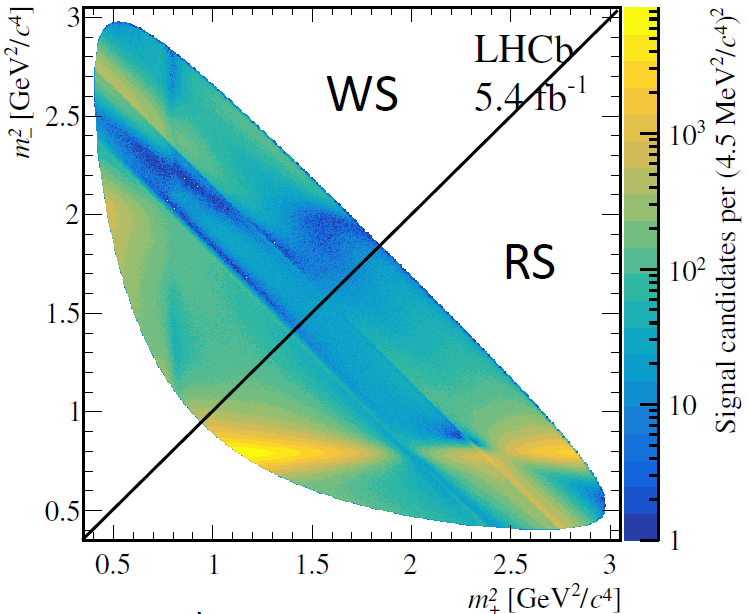
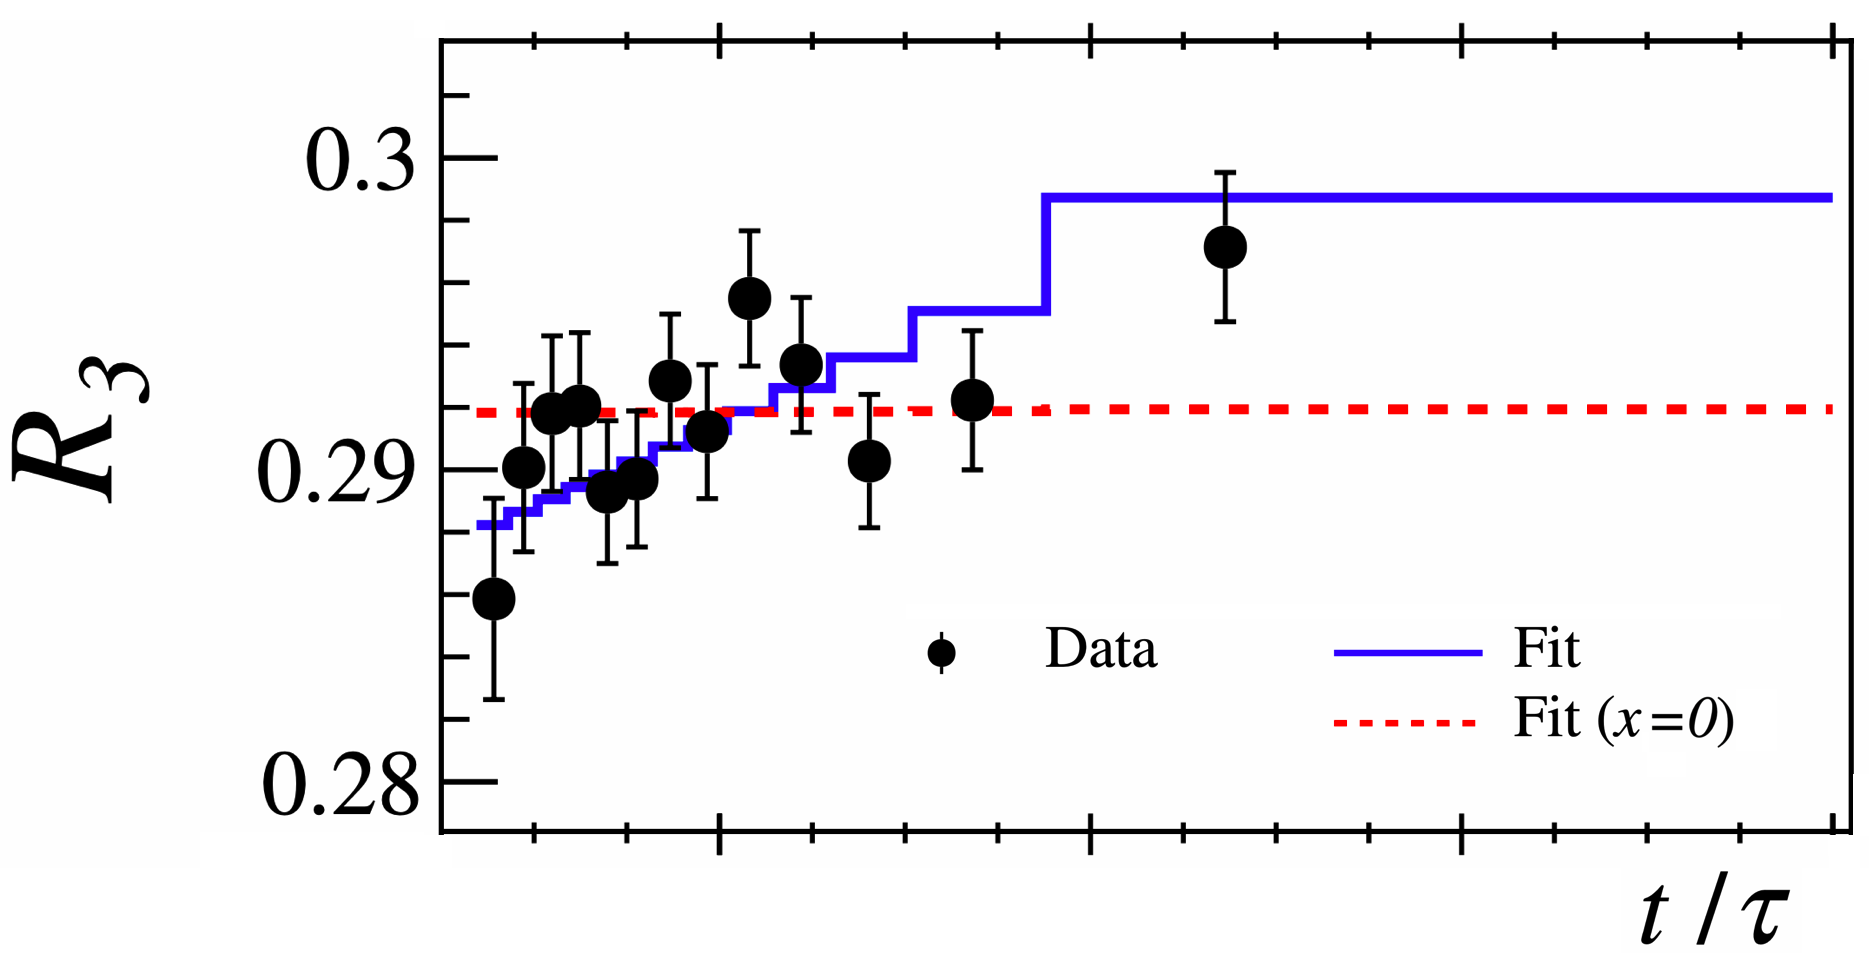
LHCb physicists used the D0 meson decays D0→Ks0π+π– in the mass difference measurement. The decays were studied with the help of the so-called Dalitz plot, invented in order to study particle decays into three particles. The axes of the plot are the squares of the invariant masses of two pairs of the decay products, m2(Ks0π±) and m2(Ks0π∓). A joint analysis of the Dalitz plot and decay time distributions allowed to determine the value of normalized mass difference, x, together with other oscillation and CP violation parameters. The value of x announced today is different from zero with a precision of more than 7 standard deviations (see above) and constitutes the first observation of a non-zero value of x. This value determines the mass difference m1-m2, and in this way, the oscillation frequency. The image shows the decay time integrated Dalitz plot distribution. In the RS (Right Sign) part of the plot we find events in which D0 or D0 mesons have not oscillated before they decayed and in the WS (Wrong Sign) part those which oscillated. The analysts divided the Dalitz plot into regions and measured the oscillations separately in these regions. A typical distribution of WS/RS decays is show above. Data (black points with error bars) are not consistent with prediction for x=0 (red points) but are with x of about 4×10⁻³ (blue histogram). Note also a horizontal band in the RS side part of the image indicating the presence of intermediate K* meson in the D0 or D0 decays.
More details can be found in the LHCb paper, as well as, in the seminar and workshop presentations. Read more in the CERN update and in the Conversation article.